
CrowdMarketeers - think 'outside our webs' to measure our online audiences
Chris Addison and Luz Marina Alvare (IFPRI) explain ways to 'think beyond the web', beyond our domains, to measure online audiences.
Web statistical tools have made it easy to measure visits, but it provides the wrong idea as to what is important when working out the audiences that we need to be reached. Perhaps, we need to start thinking further than our organizations Domain URL. We need to think 'outside our- web.' Make sure that other Domains contain the research terms we want to reach. Then a new way to measure audiences opens up.
We all have the roughly identical world maps of our visitors from Google. The United States is colored in the heaviest green, then perhaps Europe followed by Asia. Africa probably has the lightest shades of green on the map. But this view just shows overall numbers of visitors, so no surprise that shows the most visitors come from the most connected countries. We get a very different view when we look at what proportion of the internet audience we reach in each country. This isn’t so hard to do, we have figures for how many people are connected to the internet from the International Telecommunications Union and by dividing the number of visits we have by this number we get a proportional value of the reach we have. For IFPRI the picture immediately changes and our greatest reach appears to be in Ethiopia, while the United States suddenly drops to being below the top 60 countries in term of reach. A new view of what is really happening in terms of the proportion of the audience we are reaching is displayed and which countries are worth investigating more.
Where does our audience come from?
The audience doesn’t arrive directly to the front page of your website, they come through intermediaries and different pathways. These sites and services we have called “crowdmarketeers”. The crowdmarketeers market the website to a crowd on our behalf, but often without our knowledge unless we use the analytical tools to identify them and learn more of our users behavior. An organizations visibility, impact and prestige grow based on these marketeers rather than just our own efforts.

Who are the crowdmarketeers
Even though we crowd market our products through email, we have to acknowledge the key role played by academic directories and search engines such as REPEC, Google Scholar, Google Books and sites such as Wikipedia. Twitter, Facebook and scholarly social media services such as Mendeley and Zotero which are based on people networking are particularly powerful crowdmarketeers.
Different products have different staying power
In looking into the measurement of online use, we find that different products behave differently and have different crowd marketeers. Products like the Global Hunger Index are visited all year round, while other publications have a short shelf life.
Where are the conversations happening?
Different marketeers play different roles depending on the topic. The conversations on a particular issue are found in different places. For example hunger is heavily discussed in the blogosphere, but hardly appears in the search engines. Agriculture is a major proportion of Wikipedia, but hardly appears in the LinkedIn community mentioned.
Different CrowdMarketeers for different types of audiences
Different crowd marketeers bring different types of visitors. If you are looking simply at volume then Wikipedia, Feedburner, Email and Google Books prove to be the most important. If you look at how many pages each visitor vists, then websites are more important. The Washington post, Nestle, World Food Program were the top sites by this criteria. They were followed by directories such as REPEC, ELDIS and Google Books which are more likely to appeal to researchers. Somewhere in the middle are the feed and email subscribers using feedburner services to stay in touch with changes to the IFPRI website. Finally if we look at average time on the site we get a different list with email clearly at the front, Google books, ELDIS and SciDev. The mobile site now is growing and showing that visitors are spending more time on the website.
Different CrowdMarketeers reach different audiences around the world.
Email reaches around the world but social media has more impact in the US India and Europe. Wikipedia brings comparatively more users from Germany. Facebook brings visitors to the website from across Africa but particularly Kenya. Feedburner brings a comparatively large audience from Australia, second only to the United States. In Africa, the number of users of Social Media is growing, most specially Facebook and Twitter.
Learning more about the audience
 We can measure different user profiles and assess quality of that audience using some of the advanced Google analytics tools. For example we can track user behavior around two sites which bring traffic to IFPRI.ORG, careers.ifpri.org and bbc.co.uk. The graph right shows the differences in new vs returning visitors. As might be expected a careers sites bring a stream of regular visitors who return looking for recent vacancies, while the BBC Newsbring one off visitors who have little ongoing interest in IFPRI but are attracted by the news story on the BBC News site.
Scholarly marketeers
Our researchers serve as marketeers too when they are using scholarly social media resources such as Mendely, Zotero, Google Books.
For the 2020 conference a community on the topic Agriculture Nutrition and Health was built in Mendeley. This community now has 149 members, and each member has its readers followers that gives visibility to other communities we did not know about. The process continues feeding by itself. To achieve this would have required a tremendous effort if it was done by only staff of one organization.
Wikipedia
Special mention needs to be given to Wikipedia as the 'Uber' CrowdMarketeer. We discovered that over 120 wikipedia pages brought traffic to the IFPRI website. Pages in Chinese for IFPRI which we did not know existed were produced by students in Taiwan. The Global Hunger Index Wikipedia page was visited 3000 times in January. We could have not reached that audience with only IFPRI’s website Global Hunger Index page. Particularly now that Wikipedia is embedded in Facebook the combination of the platform and likes leads to an ever increasing audience.
Consequences and effects
As quantitative gains IFPRI and the scholarly marketeer will have more readers, visists, followers, citations, and links.
From the qualitative perspective, the individual marketeer might get e-mail overflow, but gain online presence, prestige and reputation.
Reach
If we look at the effects for one campaign, a combination of classical media with stories on the BBC, in the Guardian and Economist, Le Monde and El Pais together with social media brought the effect below, over 7,000 visits in one day.

How can we differentiate quality from quantity?
Tools such as Google Analytics don’t just allow us to see the impact of campaigns, such as the launch of our own Global Hunger Index leading to three times as much traffic to the website, but also through the motion graph being able to watch the roles of different media outlets in reaching the audience and seeing how this fitted with the role of social media. We could compare stories in the BBC and the Economist with the influence of Facebook and Twitter.
Web statistical tools have made it easy to measure visits, but it provides the wrong idea as to what is important when working out the audiences that we need to be reached. Perhaps, we need to start thinking further than our organizations Domain URL. We need to think 'outside our- web.' Make sure that other Domains contain the research terms we want to reach. Then a new way to measure audiences opens up.
We all have the roughly identical world maps of our visitors from Google. The United States is colored in the heaviest green, then perhaps Europe followed by Asia. Africa probably has the lightest shades of green on the map. But this view just shows overall numbers of visitors, so no surprise that shows the most visitors come from the most connected countries. We get a very different view when we look at what proportion of the internet audience we reach in each country. This isn’t so hard to do, we have figures for how many people are connected to the internet from the International Telecommunications Union and by dividing the number of visits we have by this number we get a proportional value of the reach we have. For IFPRI the picture immediately changes and our greatest reach appears to be in Ethiopia, while the United States suddenly drops to being below the top 60 countries in term of reach. A new view of what is really happening in terms of the proportion of the audience we are reaching is displayed and which countries are worth investigating more.
Where does our audience come from?
The audience doesn’t arrive directly to the front page of your website, they come through intermediaries and different pathways. These sites and services we have called “crowdmarketeers”. The crowdmarketeers market the website to a crowd on our behalf, but often without our knowledge unless we use the analytical tools to identify them and learn more of our users behavior. An organizations visibility, impact and prestige grow based on these marketeers rather than just our own efforts.

Who are the crowdmarketeers
Even though we crowd market our products through email, we have to acknowledge the key role played by academic directories and search engines such as REPEC, Google Scholar, Google Books and sites such as Wikipedia. Twitter, Facebook and scholarly social media services such as Mendeley and Zotero which are based on people networking are particularly powerful crowdmarketeers.
Different products have different staying power
In looking into the measurement of online use, we find that different products behave differently and have different crowd marketeers. Products like the Global Hunger Index are visited all year round, while other publications have a short shelf life.
Where are the conversations happening?
Different marketeers play different roles depending on the topic. The conversations on a particular issue are found in different places. For example hunger is heavily discussed in the blogosphere, but hardly appears in the search engines. Agriculture is a major proportion of Wikipedia, but hardly appears in the LinkedIn community mentioned.
Different CrowdMarketeers for different types of audiences
Different crowd marketeers bring different types of visitors. If you are looking simply at volume then Wikipedia, Feedburner, Email and Google Books prove to be the most important. If you look at how many pages each visitor vists, then websites are more important. The Washington post, Nestle, World Food Program were the top sites by this criteria. They were followed by directories such as REPEC, ELDIS and Google Books which are more likely to appeal to researchers. Somewhere in the middle are the feed and email subscribers using feedburner services to stay in touch with changes to the IFPRI website. Finally if we look at average time on the site we get a different list with email clearly at the front, Google books, ELDIS and SciDev. The mobile site now is growing and showing that visitors are spending more time on the website.
Different CrowdMarketeers reach different audiences around the world.
Email reaches around the world but social media has more impact in the US India and Europe. Wikipedia brings comparatively more users from Germany. Facebook brings visitors to the website from across Africa but particularly Kenya. Feedburner brings a comparatively large audience from Australia, second only to the United States. In Africa, the number of users of Social Media is growing, most specially Facebook and Twitter.
Learning more about the audience
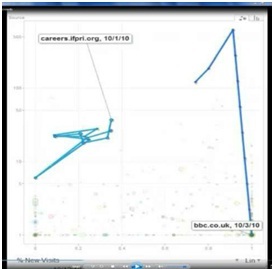 We can measure different user profiles and assess quality of that audience using some of the advanced Google analytics tools. For example we can track user behavior around two sites which bring traffic to IFPRI.ORG, careers.ifpri.org and bbc.co.uk. The graph right shows the differences in new vs returning visitors. As might be expected a careers sites bring a stream of regular visitors who return looking for recent vacancies, while the BBC Newsbring one off visitors who have little ongoing interest in IFPRI but are attracted by the news story on the BBC News site.
Scholarly marketeers
Our researchers serve as marketeers too when they are using scholarly social media resources such as Mendely, Zotero, Google Books.
For the 2020 conference a community on the topic Agriculture Nutrition and Health was built in Mendeley. This community now has 149 members, and each member has its readers followers that gives visibility to other communities we did not know about. The process continues feeding by itself. To achieve this would have required a tremendous effort if it was done by only staff of one organization.
Wikipedia
Special mention needs to be given to Wikipedia as the 'Uber' CrowdMarketeer. We discovered that over 120 wikipedia pages brought traffic to the IFPRI website. Pages in Chinese for IFPRI which we did not know existed were produced by students in Taiwan. The Global Hunger Index Wikipedia page was visited 3000 times in January. We could have not reached that audience with only IFPRI’s website Global Hunger Index page. Particularly now that Wikipedia is embedded in Facebook the combination of the platform and likes leads to an ever increasing audience.
Consequences and effects
As quantitative gains IFPRI and the scholarly marketeer will have more readers, visists, followers, citations, and links.
From the qualitative perspective, the individual marketeer might get e-mail overflow, but gain online presence, prestige and reputation.
Reach
If we look at the effects for one campaign, a combination of classical media with stories on the BBC, in the Guardian and Economist, Le Monde and El Pais together with social media brought the effect below, over 7,000 visits in one day.

How can we differentiate quality from quantity?
Tools such as Google Analytics don’t just allow us to see the impact of campaigns, such as the launch of our own Global Hunger Index leading to three times as much traffic to the website, but also through the motion graph being able to watch the roles of different media outlets in reaching the audience and seeing how this fitted with the role of social media. We could compare stories in the BBC and the Economist with the influence of Facebook and Twitter.
posted by Peter Ballantyne at Saturday, February 25, 2012
0 comments


